HTML report
The results of pemcoupling and pemcoupling-composite
are summarized in HTML reports. A report is generated for each
injection subdirectory and in the composite coupling functions
subdirectory. This page shows examples these summary pages.
pemcoupling report

The pemcoupling report links to the config file used to
analyze the injection, ratio plots (if generated) showing
injection-to-background ratios for all channels, and coupling
function data and plots. The channel rows are colored accordingly:
| Color | Meaning |
|---|---|
| Green | Channel produced coupling functions without issues |
| Yellow | Channel produced coupling functions but was not given calibration data, so no calibrated coupling function is shown |
| Orange | Channel did not produce coupling functions nor upper limits (usually because the injection was not witnessed by the channel) |
| Red | Channel did not produce coupling functions because it
was saturated by the injection (and ignore_saturated
option in the config was set to true) or because it
was not found on NDS2 (i.e. the channel does not exist) |
pemcoupling-composite report
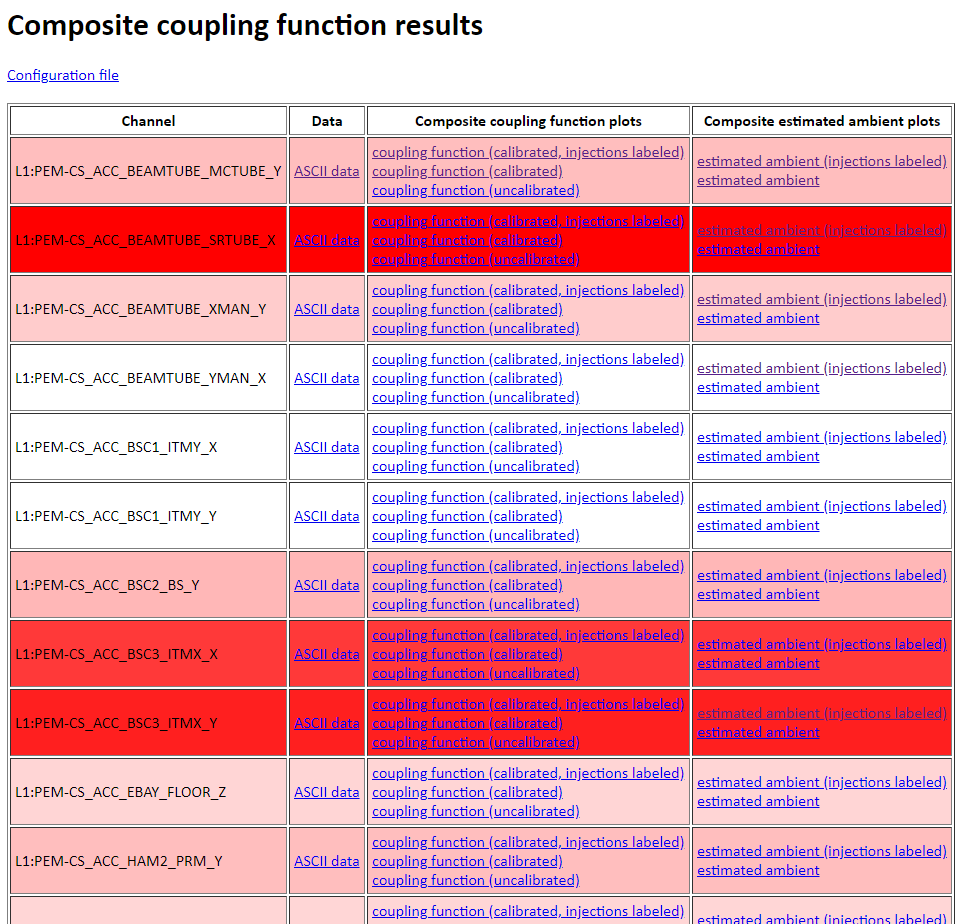
The pemcoupling-composite report shows links to all
composite coupling functions and estimated ambients, with rows
colored based on how close to the DARM background the estimated
ambient is. The extreme cases are tabulated below.
| Color | Meaning |
|---|---|
| White | \(\textrm{max(estimated ambient)} / \textrm{DARM} \leq 0.1\) |
| Red | \(\textrm{max(estimated ambient)} / \textrm{DARM} \geq 1\) |