Site-wide coupling functions
Summary plots can be generated for stations or entire sites with pemcoupling-sitewide. A summary plot is generated by choosing the highest value at each frequncy bin across all channels at the desired station/site. Measured values take precedence over upper limits.
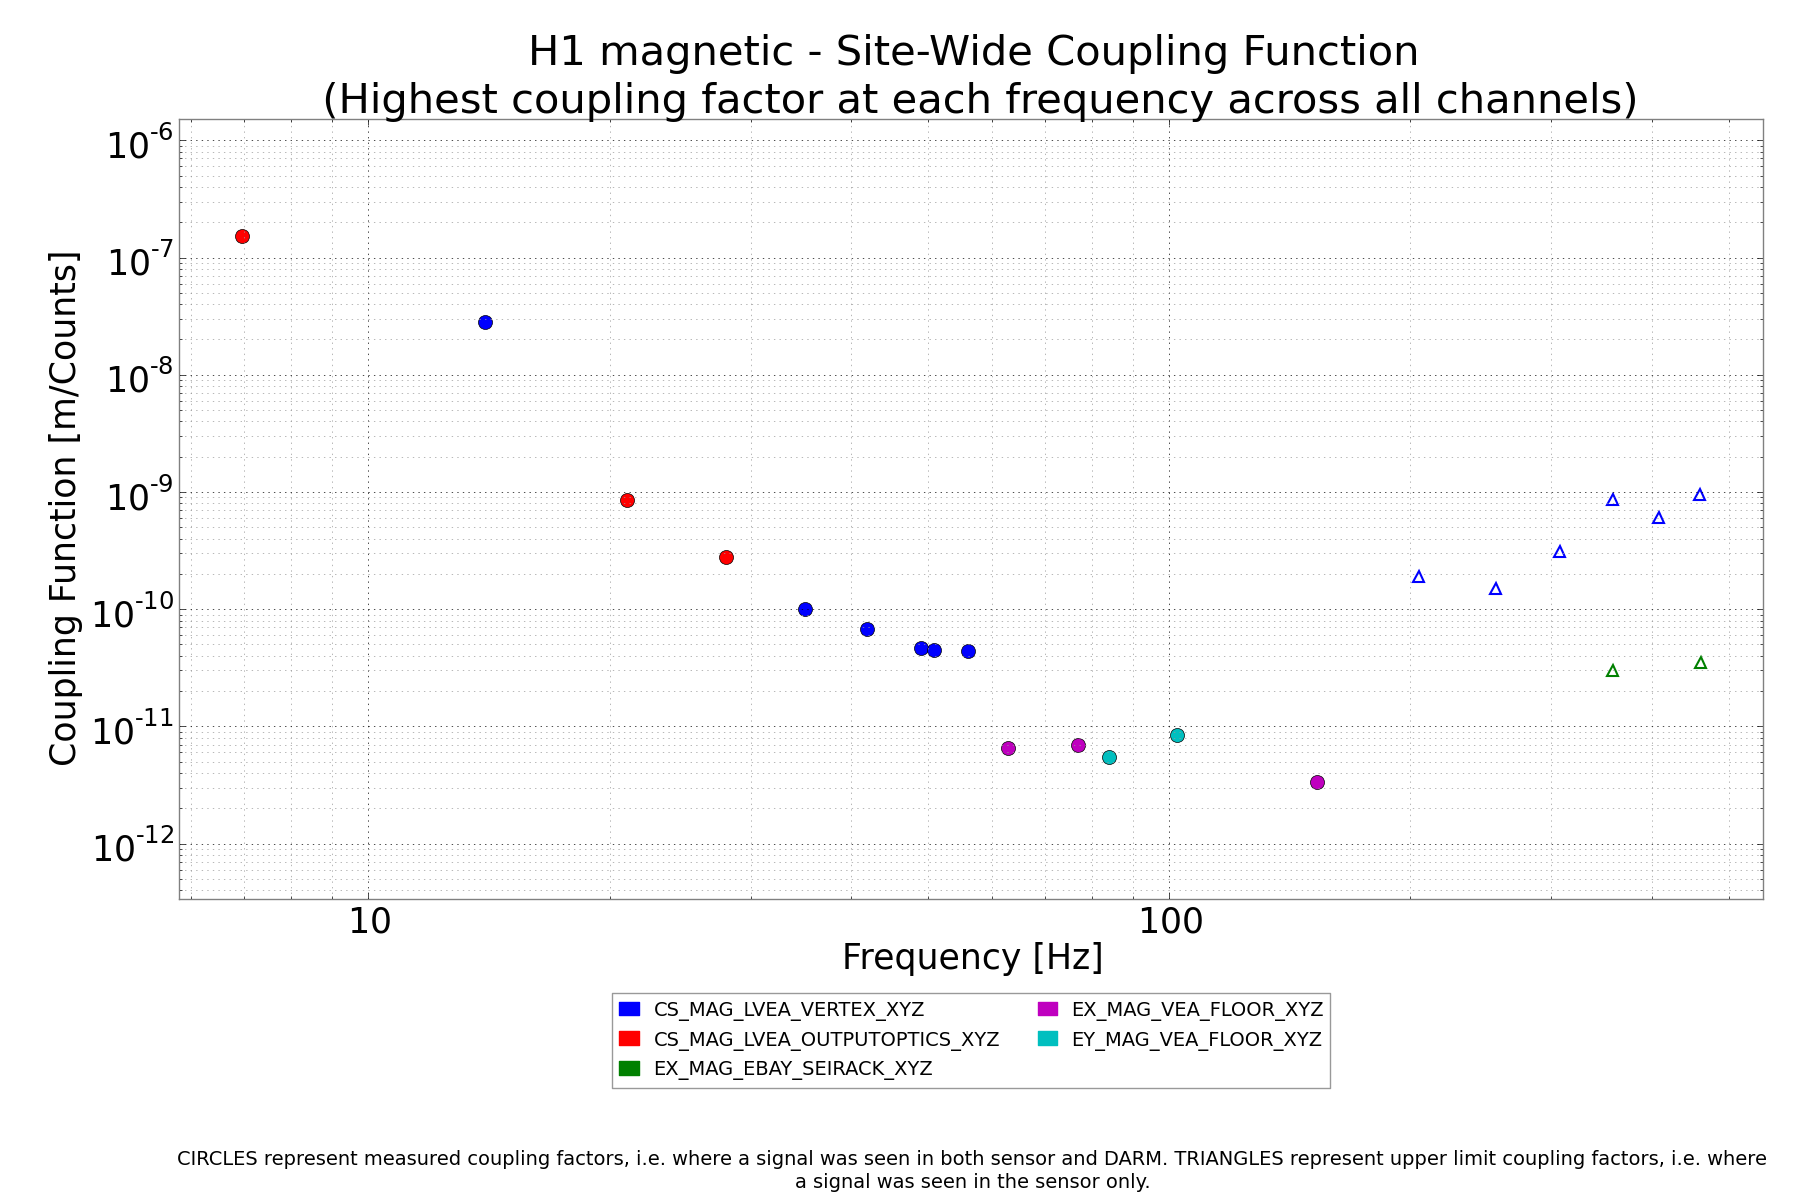
Maximum coupling function
This shows the highest coupling at each frequency bin for all LHO magnetometers.
Maximum estimated ambient
This shows the highest estimated ambient at each frequency bin for all LHO magnetometers.
